Alerts and monitoring
Statistics dashboard
The HAProxy Statistics dashboard provides a near real-time feed of information that you can use to troubleshoot proxied services, get insights about your traffic, monitor the load on servers, and even perform administrative actions such as placing a server in maintenance mode or enabling health checks.
Alternatively, you can view statistics by calling the HAProxy Runtime API command show stat.
Enable the dashboard Jump to heading
HAProxy Fusion
In HAProxy Fusion, the Statistics dashboard is already enabled. Access it via Overview > Stats.
HAProxy ALOHA
In HAProxy ALOHA, statistics also appear on the Stats tab.
To enable the Statistics dashboard, add the following frontend to the load balancer configuration. This will serve the dashboard at http://<IP ADDRESS>:8404/stats.
haproxy
haproxy
In this frontend:
bindsets which address and port you’ll use to access the dashboard.stats enableis required to define this frontend as an active statistics dashboard.stats refreshconfigures how often the dashboard will automatically refresh within your browser.stats uri(optional) changes the URL’s path.stats show-modulesAvailable since HAProxy 2.3 / HAProxy Enterprise 2.3r1 / HAProxy ALOHA 13.0 (optional) adds statistics for SSL, HTTP/1, HTTP/2, HTTP/3, and QUIC modules.
For more information, see stats enable.
Enable administrative actions Jump to heading
From the dashboard, you can perform some administrative actions. When administrative actions are enabled, a dropdown menu appears at the bottom of the page with actions you can apply. To perform an action, select rows, then select the action from the drop-down menu, and then click Apply.
To enable administrative actions, add the stats admin line to the stats frontend:
haproxy
haproxy
where:
stats adminallows users to perform administrative actions.
You can control who gets administrative privileges:
- Use an ACL statement to restrict who can access administrative actions. For example, the statement
if TRUEgives all users access, but you can also create a condition that checks the client’s source IP address. - Specify
stats auth <username>:<password>to enforce Basic authentication.
Actions include:
| Administrative Action | Description |
|---|---|
Set state to READY |
The selected server will receive traffic. The final status of the server will be determined based on its configured health check. |
Set state to DRAIN |
The selected server won’t accept any new connections other than those accepted through session persistence. |
Set state to MAINT |
The selected server won’t accept any new connections at all and health checks will be stopped. |
| Health: disable checks | Disable a server’s health checks. |
| Health: enable checks | Enable a server’s health checks. |
Health: force UP |
Force a server’s health check status immediately to UP. |
Health: force NOLB |
Force a server’s health check status to NOLB. This stops the server from accepting new, non-persistent connections. |
Health: force DOWN |
Force a server’s health check status immediately to DOWN. |
| Agent: disable checks | Disable a server’s agent checks. |
| Agent: enable checks | Enable a server’s agent checks. |
Persist statistics after reload Jump to heading
This section applies to:
- HAProxy 3.3 and newer
- HAProxy Enterprise 3.3r1 and newer
- HAProxy ALOHA 18.0 and newer
Experimental feature
This feature is currently experimental. For versions 3.0 to 3.2, and to persist statistics without using an experimental feature in version 3.3, see the manual dump stats-file Runtime API command.
The load balancer can persist your statistics counters after a reload by temporarily storing the counters in Linux shared memory. Linux shared memory facilitates Interprocess Communication (IPC). In this way, the running load balancer process saves its stats to the shared memory location, and when the new load balancer process is created upon reload, the new process is able to read the statistics from that memory location and populate its counters accordingly. The HAProxy Stats page uses these counters. Only proxy counters are included, that is, counters for frontends, backends, servers, and listen sections.
To persist the statistics for your load balancer:
-
Add the
expose-experimental-directivesandshm-stats-fileglobal directives to your global configuration, providing a name for the shared memory location forshm-stats-file:haproxyglobalexpose-experimental-directivesshm-stats-file /dev/shm/myshmhaproxyglobalexpose-experimental-directivesshm-stats-file /dev/shm/myshmInfo
Your system must support the
shm_open()system call to use this feature. -
Assign GUIDs to each frontend, backend, listen, and server object in your configuration. For example, here is a simple configuration with one frontend that routes to one backend with three servers. The frontend, backend, and servers each have a globally unique identifier assigned:
haproxyfrontend cartguid 3310ec6c-905b-4b22-a71f-f1d7b42ca080bind :80default_backend cartserversbackend cartserversguid 173b3609-91ff-4596-b106-0fd43fff87d3balance roundrobinserver cart1 172.16.0.11:8080 guid 82438d6f-ee1a-452d-a9d1-b1761ea286e4server cart2 172.16.0.12:8080 guid 6afc7efb-3c80-4bd2-82a7-a6e6a6ee4171server cart3 172.16.0.13:8080 guid 2ddc039a-0429-4135-bea1-87d5c781d98ahaproxyfrontend cartguid 3310ec6c-905b-4b22-a71f-f1d7b42ca080bind :80default_backend cartserversbackend cartserversguid 173b3609-91ff-4596-b106-0fd43fff87d3balance roundrobinserver cart1 172.16.0.11:8080 guid 82438d6f-ee1a-452d-a9d1-b1761ea286e4server cart2 172.16.0.12:8080 guid 6afc7efb-3c80-4bd2-82a7-a6e6a6ee4171server cart3 172.16.0.13:8080 guid 2ddc039a-0429-4135-bea1-87d5c781d98a -
Reload the load balancer. Do not restart the load balancer as it will reset the statistics.
Running in Docker?
You can use the following command to reload the load balancer when running in Docker:
nixdocker kill -s USR2 <haproxy container ID or name>nixdocker kill -s USR2 <haproxy container ID or name>If you are used an image built with s6-overlay, as indicated by the presence of
s6in the image name, you can use the following command to send the SIGUSR2 signal to the haproxy process:nixdocker exec <haproxy container ID or name> /package/admin/s6/command/s6-svc -2 /run/s6-rc/servicedirs/haproxynixdocker exec <haproxy container ID or name> /package/admin/s6/command/s6-svc -2 /run/s6-rc/servicedirs/haproxy -
Check the statistics page or use the show stat Runtime API command to see that the statistics were persisted through the reload.
What the dashboard displays Jump to heading
The dashboard shows information for the load balancer process, frontends, and backends. At the top of the screen you’ll find general process information, a color legend, display options, and helpful links to external resources.
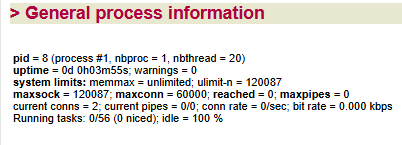
General process information Jump to heading
The General process information section provides details about the load balancer process itself, along with settings from the global section of the configuration such as global maxconn.
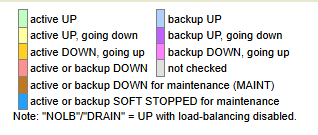
Color legend Jump to heading
The color legend shows what colors are used to indicate server state:
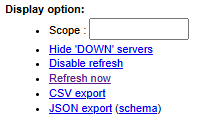
Display options Jump to heading
The Display options allow you to customize the display.
where:
| Option | Function |
|---|---|
| Scope | Display only frontend, backend, and listen sections whose names contain the specified text. |
| Hide ‘DOWN’ servers | Show only UP servers. |
| Disable refresh | Stop refreshing of the page. |
| Refresh now | Trigger a page refresh. |
| CSV export | Export statistics to file as comma-separated-values. |
| JSON export (schema) | Export statistics to file as JSON schema. |
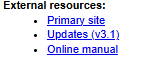
External resources Jump to heading
The External resources section provides helpful links.
Frontend statistics Jump to heading
A frontend is what a client connects to. As requests enter the load balancer, and as responses are returned to the client, they pass through the frontend. So, it has access to end-to-end timings, message sizes, and health indicators that encompass the whole request/response lifecycle. Below we explore the statistics related to frontends.
| Statistic | Description |
|---|---|
| Queue | The Queue section is not used for frontends. |
| Session rate | The Session rate section, in the context of a frontend, describes the rate at which clients are connecting to the load balancer. The Cur column shows the current rate at which client sessions, or fully established connections between client and server, are being created. If you hover over this field, the page displays the following drilldown metrics:
The Max column shows the most sessions that have ever been in use simultaneously. If you hover over this field, the page displays the following drilldown metrics:
The Limit column shows the maximum number of sessions per second that the frontend will accept, as set by the rate-limit sessions setting. If this limit is exceeded, additional connections are kept pending in the socket’s backlog (in system buffers). |
| Sessions | In the context of a frontend, the Sessions section counts the number of sessions, or full client-to-server connections, in use on the load balancer. The Cur column shows the current number of established sessions. The Max column shows the most sessions that have ever been simultaneously established. The Limit column shows the most simultaneous sessions that are allowed, as defined by the When you hover over the Total column, the page displays the following drilldown metrics:
The LbTot and Last columns aren’t used in the Sessions section. |
| Bytes | In the context of a frontend, the Bytes section displays the cumulative amount of data sent and received between the load balancer and downstream clients.
|
| Denied | The Denied section shows the number of requests and responses that were rejected because of security concerns. The Req column shows the number of requests that were denied due to any of the following configuration directives placed in the frontend or listen section:
The Resp column shows the number of responses that were denied by an |
| Errors | In the context of a frontend, only the Req column is used in the Errors section. It shows the number of requests that encountered an error. Possible causes include:
|
| Warnings | The Warnings section is not used for frontends. |
| Server | The only field from the Server section that applies to a frontend is the Status field. When Status is |
Backend statistics Jump to heading
A backend is a pool of load-balanced servers. The load balancer sends requests to a backend and then receives a response from one of the active servers. Statistics here include information about the health of each server, timings related to queuing, connecting, receiving responses, and request rates.
| Statistic | Description |
|---|---|
| Queue | The Queue section applies only to backends and shows how long clients are waiting for a server to become available. The load balancer is able to queue connections when you use the
|
| Session rate | In the context of a backend server, a session means the same as a connection. These statistics show the rate at which connections are being made to a server.
|
| Sessions | In the context of a backend, the Sessions section shows the number of current connections to any of the active servers.
|
| Bytes | In the context of a backend, the Bytes section displays the amount of data sent and received between the load balancer and the upstream server.
|
| Denied | The Denied section shows the number of requests and responses that were rejected because of security concerns.
The bottom row shows the sum of these individual server metrics. |
| Errors | The Errors section shows the number of errors related to communicating with a backend server.
|
| Warnings | The Warnings section in a backend displays the number of retries and redispatches.
|
| Server | In the context of a backend, the Server section shows various details about the status, health, and weight of each server.
|
See also Jump to heading
For more information on functional components that generate statistics, see these sections:
- For complete concepts on backends, see Backends.
- For complete concepts on frontends, see Frontends.
- For complete concepts on health checks, see Health checks.
You can use the HAProxy Runtime API to perform a number of operations on a running HAProxy service without interrupting it. For example, you can disable or enable a frontend:
For complete information on topics related to statistics, see the HAProxy Configuration Manual.
- To set the maximum number of connections, see maxconn reference.
- To set the maximum number of requests that can wait in the queue, see maxqueue reference.
- To enable session redistribution in case of connection failure, see option redispatch reference.
- To set a limit on the number of new sessions accepted, see rate-limit sessions reference.
- To set the time required for a server to come up to full speed, see slowstart reference.
- To enable statistics at
adminlevel, see stats admin reference. - To enable statistics with authentication and grant access, see stats auth reference.
- To enable statistics reporting, see stats enable reference.
- To enable display of the extra statistics module, see stats show-modules reference.
- To enable statistics and define the URI prefix for accessing them, see stats uri reference.
- To set the maximum amount of time to wait for a connection, see timeout queue reference.